
This past year had some notable weather events across the U.S. - from severe weather, heatwaves, and hurricanes, to droughts, flooding, and robust winter storms. And, most can't forget a major cold snap to finish it all out! Let's take a look back at 2022 for the eastern half of the country.
January 28th-30th Nor'easter:
Ingredients came together off the Southeast region for a coastal storm that tracked up the Eastern Seaboard that began on the 28th. As it strengthened while surging north/northeastward, a fresh injection of cold air on the backside clashed with a system from the northwest, allowing for heavy snow that stretched up the I-95 corridor from Virginia to Maine. Coastal locales from Delaware up through Maine endured the bulk of the snow as a widespread 12-18"+ fell, with some areas such as eastern Massachusetts, Connecticut, and Rhode Island seeing over two feet. Elsewhere, many still saw several inches of snow that caused issues, though again, the heaviest snow hugged the coastline given the system's track farther offshore. In addition, this Nor'easter was officially classified as a blizzard, especially along the Delmarva and up the Jersey coastline. As a result of the explosive cyclone offshore, wind gusts in excess of 40-50mph+ were observed with some areas recorded gusts in the 70s and 80s. This combination of strong winds and heavy snow resulted in both whiteout conditions and snow drifts that caused state emergencies and shutdowns.

Rare April Late-Season Nor'easter:
Nor'easters don't typically develop after March - they're notoriously known to form in the deep winter months along the East Coast due to the differences in air masses (cold air to the north, warm air to the south). It's when we see this contrast maximized, however, that we can see them develop in the spring such as the one that occurred in 2022. On April 18th, a low pressure developed off the North Carolina coast as a high pressure shifted toward Nova Scotia, supplying cold air. Thereafter, the coastal storm steadily strengthened, while taking a northward track that hugged the coastline. This type of track ensures that the heaviest snow remains further inland, rather than along the I-95 corridor. Pennsylvania up to New York and into New England were blanketed by heavy wet snow of 3-5''+, with some areas seeing over a foot. This wet snow is common in the spring months as temperatures become marginal, therefore making the snow much more heavy and dense. As a result, this caused over 100,000 power outages along with downed trees/branches that resulted in damage to property and vehicles.


Images Courtesy of the National Weather Service
June 13th-14th Derecho:
A derecho is classified by 58+mph wind gusts along an axis that expands at least 240 miles in length. On June 13th-14th, 2022 a line of severe thunderstorms barreled through northeast Illinois, Indiana, Ohio, and then down into West Virginia and Virginia, resulting in over 600 wind reports with greater than 300 reaching the NWS severe wind threshold of 58+mph. Chicago O'Hare International Airport recorded a wind gust of 84 mph, with a 98 mph gust coming out of Fort Wayne International Airport in Indiana. You tend to see these types of gusts with category 1 hurricanes! These storms tracked along a warm front with warm, humid conditions to the south and cooler air to the north, which harbored an unstable environment allowing for these thunderstorms to maintain as they raced southeastward. Furthermore, within the derecho was a whole other phenomenon called a "microburst". This is where heavy rain a few thousand feet in the air falls through a dry layer, in which evaporation occurs, making the air now denser than the surrounding environment. This heavier air can now spread out, resulting in damaging wind gusts. Reports of 80 to just over 90 mph gusts were recorded in eastern Ohio from this occurrence, causing widespread damage that resulted in over a 1,000 downed trees and 500,000+ power outages.

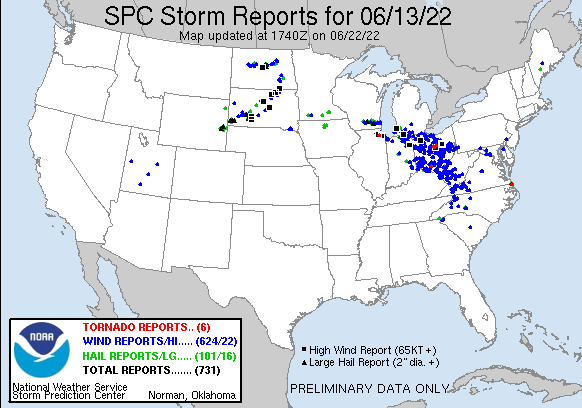
Images courtesy of Iowa Environmental Mesonet (Top) & Storm Prediction Center (Bottom)
Catastrophic Kentucky Flooding July 25th - 29th:
Persistent heavy rainfall, training thunderstorms, and overwhelmed rivers all lead to devatating flooding in eastern Kentucky beginning July 25th and lasting over a four-day stretch. A frontal boundary stalled across eastern and southern Kentucky, where low level winds transported a lot of moisture in tandem with a favorable jet stream, and produced an efficient environment for thunderstorm complexes to form repeatedly over the same areas for days. This setup caused 3"+ of rainfall regionwide, however a narrow corridor saw anywhere from 10'' to as much as 16'' of rain. In the places that were hardest hit, the excessive rainfall qualified as a "1 in 1,000 year event". This severe flooding resulted in almost a 1,000 water rescues, where towns and communities suffered a great deal of devastation. Cars, buildings, and other infrastructure were swept away by the extreme floods.

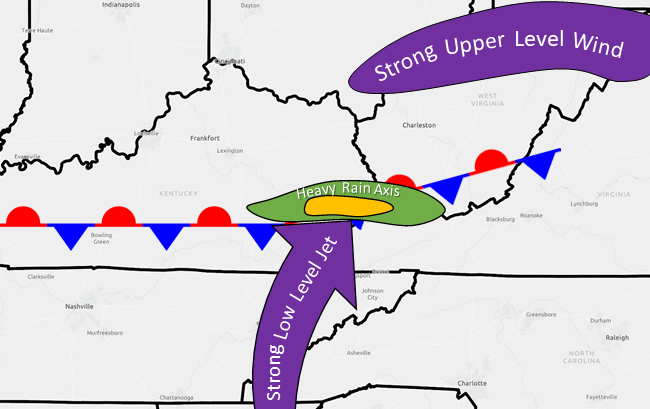
Top - Radar estimated total rainfall, Bottom - Flooding weather event ingredients. Both images courtesy of the National Weather Service.
Hurricane Ian:
Ian developed into a hurricane back on September 26th, 2022, and dramatically intensified into a Category 4 two days later as it entered into the Gulf of Mexico, where a "perfect" combination of very low wind shear and warm waters awaited its presence. By the afternoon of the 28th, Ian made landfall at Cayo Costa, FL as a major hurricane (Cat. 4). An onslaught of devastation resulted, as Ian brought numerous wind gusts over 100 mph (140 mph wind gust reported at Cape Coral), storm surge in excess of 6 feet over a 130 mile stretch from the Everglades to Venice, and over a foot of rain in several locations. In fact, a few areas recorded anywhere from 12 to 15'' of rainfall in a matter of 12 to 24 hours. Ian placed itself in the top 5 strongest cyclones to ever hit Florida, going back to when records began in the early 20th century. Astonishingly, Ian's path eerily followed Hurricane Charley's track and landfall location in 2004, although Ian was the larger of the two storms. Ian's wrath didn't just stop across Florida; after weakening to a tropical storm, it redeveloped into a Category 1 off the Southeast Coast. From there, Ian made a second landfall near Georgetown, South Carolina, bringing hurricane-force wind gusts, coastal and inland flooding to parts of Georgia and the Carolinas.
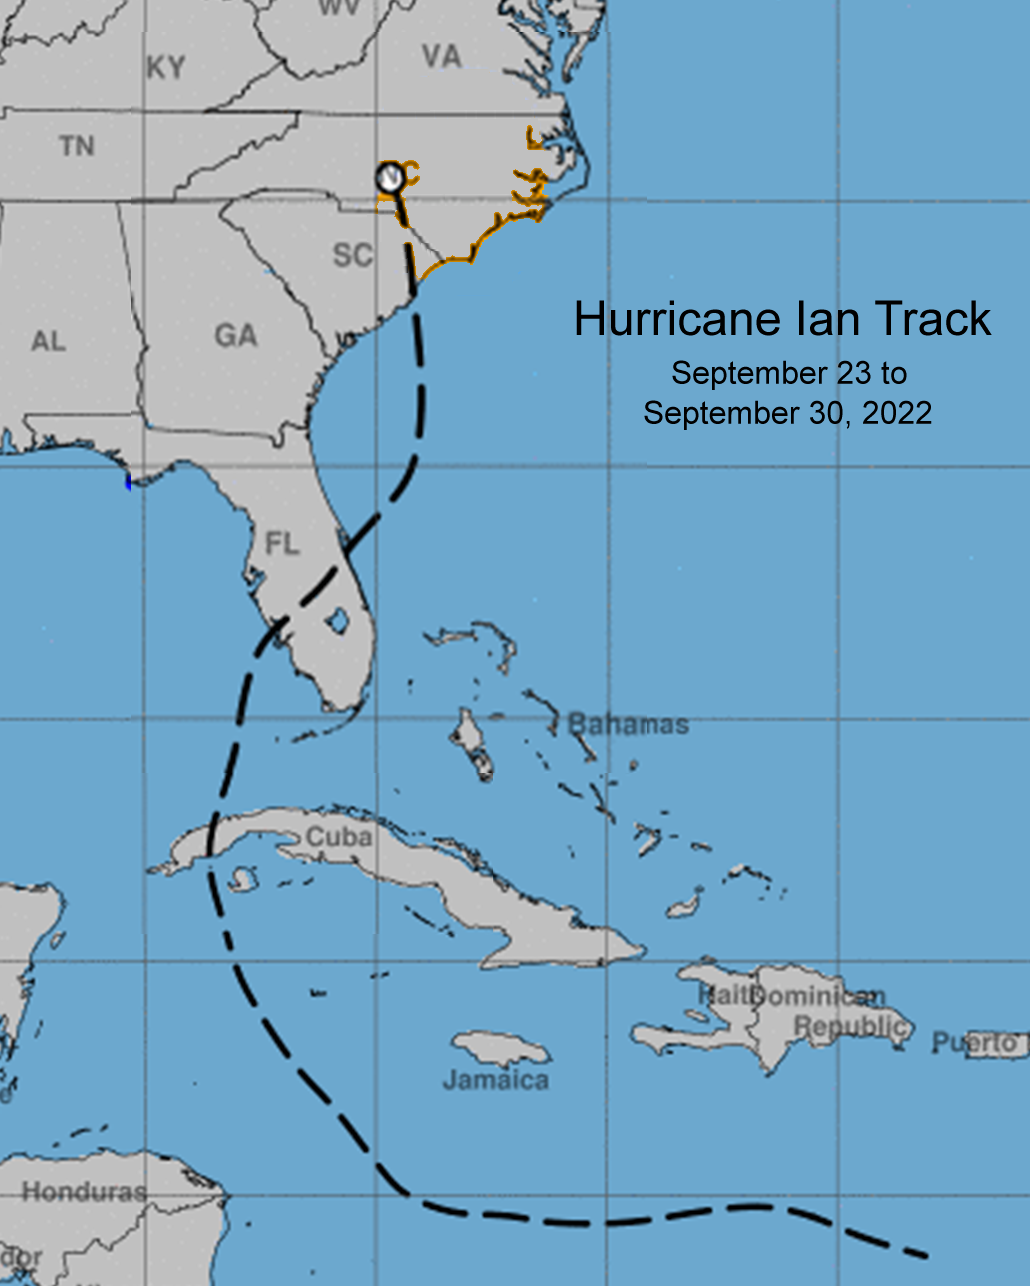

Images courtesy of PolarWx (Top) & National Weather Service (Middle, Bottom). Bottom is MRMS Reflectivity comparison of Ian (L) & Charley (R).
Historic Buffalo & Upstate New York Lake-Effect Snow Events:
Seperated by just a little more than one month, not one, but two historic lake-effect events transpired across western New York. This led to tremendous snowfall totals and chaos, with stranded vehicles, property damage/collapsed roofs, and unfortunately injuries and deaths.
Nov. 18th - 21st:
In late November 2022, a blast of arctic air pushed over the warm Great Lakes and allowed for significant lake-effect snow and persistent heavy banding to occur. Over 80 inches of snow fell in the Buffalo area, mainly south of the metro area as narrow bands off Lake Erie and Ontario developed. Places such as Orchard Park, Hamburg, and Blasdell, NY saw between 75-80", with the Buffalo Metro itself "only" seeing 3 feet of snow (36.6" to be exact). This total is now officially ranked as top 5 for the most snow to fall in a 3-day span. Not just in and around Buffalo, but other places farther north in New York (such as Watertown, Fort Drum, and Harrisville, among others), saw anywhere from 3 to 5 feet! Snowfall rates of 3-6" per hour, along with thunder/lightning, were observed within these bands.

Image courtesy of the National Weather Service - Snowfall totals ending Nov. 21st
Dec. 23rd - 25th:
The large cyclone that disrupted travel during the days just before Christmas played a major role in setting up what was officially deemed as not only a historic event, but one of the most impactful blizzards to strike Buffalo, NY. Many officials and state climatologists deem it worse than the Blizzard of 1977. As a Midwest cyclone intensified dramatically while crossing into the Great Lakes from the 20th to the 23rd, relentless lake-effect snow and strong wind gusts followed as the system lifted slowly away from the entire region. To show just how dynamic this event was, shown below is a GIF of lake-effect banding that displays nearly 72 continous hours of blizzard conditions and heavy snowfall, resulting in over 50'' of snow. Buffalo International Airport measured 51.5'' from this event, and places like Hamburg and Watertown saw just over 3 feet! There were numerous wind gusts in excess of 50 - 60 mph with even hurricane-force gusts recorded. The strong winds combined with significant snowfall rates of 2-3'' per hour, created zero-visibility at times. In fact, the Buffalo airport registered approximately 16 straight hours of zero visibility. Astonishingly, Buffalo has now surpassed 100'' for the season, officially now at 101.6'' to date, making for the snowiest start to any winter season since records began.

Animated loop of the Buffalo Lake-Effect Band Dec. 23rd - 26th
Massive December Arctic Outbreak:
A remarkable stretch of below average temperatures with frigid arctic air and blustery winds invaded the U.S. the week of Christmas. A powerful arctic cold front surged across the nation, sending temperatures below zero across the Northwest, Midwest, Great Lakes, and into the Northeast, with below freezing temperatures as far as the deep South and into the Southeast. In fact, the Treasure Coast of Florida saw some sleet. Wind chills in parts of the country were 30 to as much as 50 degrees below zero, where widespread temperature departures were 20 - 30 degrees below average. This created a situation where it put infrastructure, especially in areas not often exposed to this type of cold, in a state of stress. How did this happen? A piece of the polar vortex dipped into southern Canada, allowing for arctic air to bleed directly from it and sink southward. A common misconception is that the polar vortex is some crazy "alien" phenomenon that visits only during winter, and can be used out of context. In reality, however, the polar vortex is simply an expansive area of low pressure with cold westerly winds that harbor cold, arctic air. When it enters into a weakened state during winter, or is disrupted, it can branch off into lobes that may spill into the middle latitudes, thereby resulting in arctic outbreaks. In fact, the polar vortex is a year-round entity where it just becomes irrelevant during the warmer months since it's technically at its most weakest state, but still rotates at the poles. This blast of arctic air caused dangerous wind chills and influenced a plethora of winter storm watches and warnings that impacted millions, along with travel disruptions. Here are some incredible stats that transpired from this arctic blast:
-Nearly 60% of the entire U.S. was under some type of winter weather advisory or warning.
- Denver saw a 75 degree temperature swing from 51 to -24 degrees, and saw the largest one-hour drop from 42 degrees to 5 degrees.
- Elk Park, Montana recorded its coldest wind chill on record of -75.
- Cheyenne, WY recorded a drop from 43 degrees down to 3 degrees in only a half hour, making it the greatest one-hour temperature drop on record.
- From the Midwest to the East Coast, near record 40 - 50 degree temperature drops in a span of 6 hours resulted as the front crashed through, sending temperatures in the 40s and 50s down into the teens and single digits.


Images courtesy of Weathermodels (Top - wind chills, Bottom - 7-day averaged temperature)


