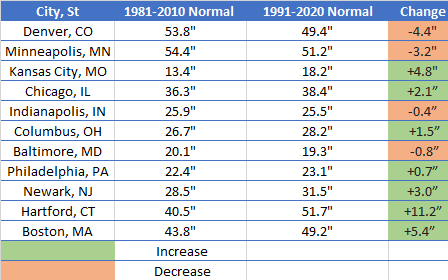

In preparation for the upcoming winter, many people in the snow and ice industry ask, "Is this going to be an above-average season?", but what is the average they are referring to and how is it calculated? While averages can be measured across a variable timeline, the standard 30-year normal is updated every 10 years and was just recently adjusted at the completion of the 2020-'21 winter season. As such, there have been some notable increases and decreases among the climate reporting sites nationally, which could mean adjustments for existing snow contracts and upcoming bids; see below.

Some major cities in the Midwest have seen a general increase of 1-2” while areas in New England have seen a major adjustment with Hartford's new normal of 51.7".
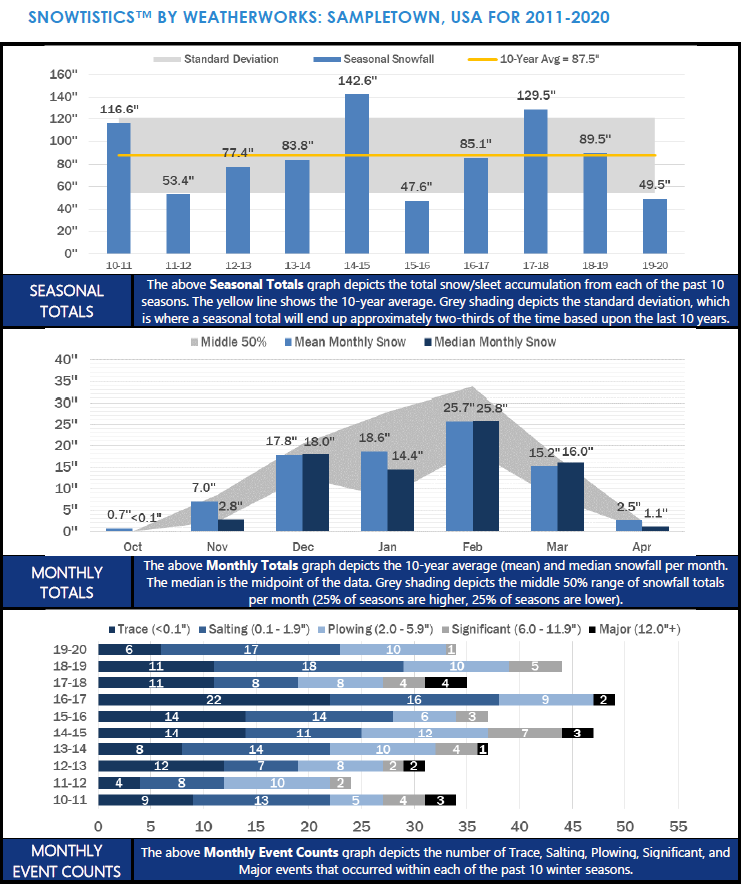
Knowing these normals and monitoring yearly changes can give you an advantage when it comes to winter preparation. From accurate bids to ensuring you're prepared with enough supplies and equipment for the busy season, our data-driven product Snowtistics® is always there to assist.
Whether you need a breakdown for a specific ZIP Code or an entire region, WeatherWorks Snowtistics® can look 5, 10, or even 30 years back at average monthly or yearly snowfall thanks to our extensive database. We provide you with event data, which breaks down the number of events based on accumulation within a specified timeframe. To help you examine the extremes, we'll also show the seasonal variability in snowfall totals so you can assess the risk and plan accordingly in your contracts.
For month of June, we are also running a Buy One, Get One Free Special on Snowtistics®! This offer is a $75+ value and is limited to one usage per customer. To access this promotion, email data@weatherworksinc.com and mention this article along with the locations you need.
