
Now that we are well into April, it is time to start thinking about severe weather season. Given the risks that these events pose to life and property, it had us wondering, what is the climatology behind severe weather across the Northeast? How many wind, hail, and tornado days do we see per year, what are the averages, seasonality, and timing of such events, and what are some other statistics behind these meteorological hazards that impact and threaten the region every year? Today, we take a deeper dive into the climatology surrounding severe weather across the Northeast, and briefly explore some of the most extreme severe weather events in the region between 2010 - 2022.
When talking about the Northeast, the rough coverage area used for this study included areas of Southeastern Virginia, spanning all the way up and along the I-95 corridor (including Long Island and the Lower Hudson Valley), and into southern New Hampshire. You may be wondering what makes a severe day? Well, there are three types of severe weather: wind, hail, and tornadoes. While tornadoes are relatively self explanatory, you may also be curious as to what makes a severe wind or hail day? For the purposes of this climatology study, severe wind and hail days were based on Storm Prediction Center (SPC) reports, with the criteria for that being winds of at least 58 mph or greater, and severe hail being hail that is 1"+ in diameter. Lastly, a "severe day" is considered as any day across the footprint that had at least one 1 wind, hail, and / or tornado report.
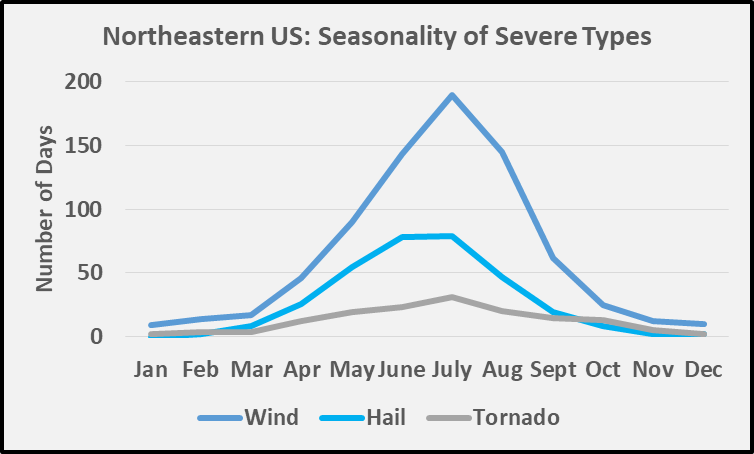
Starting out with some of the most basic counts since 2010, it is evident that wind is by far the most common severe type in the Northeast. Specifically, the Northeast has seen 763 total wind days (nearly 12000 individual wind reports), 326 total hail days (just over 1300 total hail reports), and 150 tornado days (nearly 340 total reports). On average, the Northeast typically experiences 63 severe days per year (which includes wind, hail, and tornado reports), with the most severe days per year being 77 which occurred in 2011 and the least being 50 in 2015. However, since 2010 the region has seen a whopping 814 severe days in total! In terms of the frequency of such events, wind days are the most common with nearly 94% of all severe days since 2010 including at least one wind report. This drops off pretty quickly for hail and tornadoes with 40% of all severe days seeing at least one hail report, and only 18% of all days seeing a tornado report. The years with the highest amounts of tornado days occurred in 2011 and 2019 with 18 such days occurring both years. Moreover, since 2010, 355 total tornadoes have tracked across the entire Northeast, nearly half of which occurring in the Mid-Atlantic, making this region something of a hotspot.


Courtesy of WeatherWorks Inc.
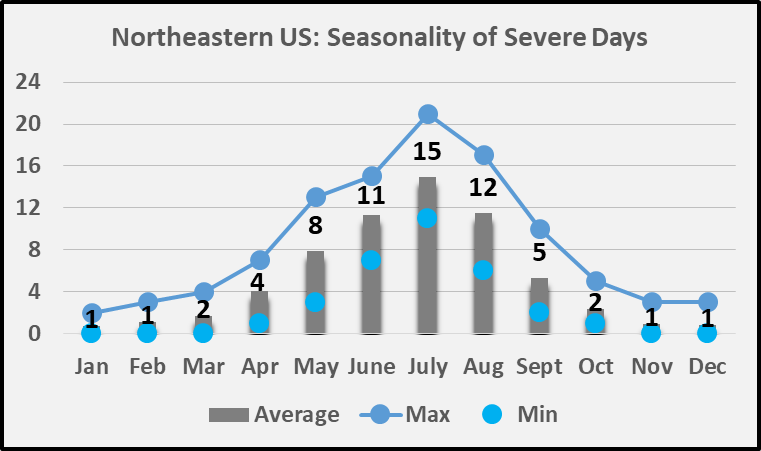
Looking at the seasonality and timing of day of Northeast severe events, we see that severe weather peaks in the summer, with nearly 15 severe days occurring each year during the month of July. However, June and August also see a fair share of severe weather, with each month averaging 11 and 12 severe days per year, respectively. In fact, even the lowest number of severe days that has occurred in July since 2010 is still greater than the maximum number of severe days corresponding to each of the months of September through April. Unsurprisingly, the bulk of significant severe weather days (i.e., days with either 50+ reports, hail of at least 1.5" in diameter, 5+ hail reports, and / or a tornado) occurs from June through August. Therefore, the seasonality of severe weather days is marked by a rather significant increase through May into June, and a sharp decline through the month of September.
Regarding the climatology behind what time of day severe weather is most common it was found that out of the 814 total severe days since 2010, roughly 86% of them occurred during the afternoon to evening timeframe (~12 - 10 PM), with the remaining 14% of all events falling during the nighttime (~10 PM - 6 AM) and morning (~6 AM - 12 PM). While this may be somewhat intuitive to some as we typically associate the occurrence of severe weather with the daytime, you may be wondering what the cause for this is? Essentially, this is due in large part to the presence of the sun during the daytime, which is crucial in heating up the earth and providing enough instability for thunderstorm formation. However, it is worth noting that it can be those more rare nighttime events that prove to be the most hazardous and life threatening, often catching people off guard as they are asleep.

Courtesy of WeatherWorks Inc.
Diving more specifically into the regionality of the severe events, we have found that severe weather significantly increases as you head south which corresponds to a sweet spot in severe weather from Maryland to D.C. and into Southeastern Virginia as previously alluded to. However, it is also notable that these areas see a slightly earlier start to the severe weather season then do those across NJ / PA, and especially up into New England. As a whole those across the Mid-Atlantic from Maryland and D.C. down to Southeastern VA (particularly in and around Richmond and Norfolk), typically see an average of ~69 severe days per year, which is more than double the average amount that all of New Jersey sees in a year at ~33 severe days per year. Heading even further north into New England we found that the frequency of severe weather continues to decline with all of Connecticut averaging nearly 16 severe days / year, and Eastern Massachusetts, including in and around Boston, only averaging ~13 severe weather days per year. When breaking down this seasonality into the specific severe weather threats, we found that both tornado and wind days peak in July, and hail days in the months of June - July.
While this gives you a general idea of severe weather climatology, you may be intrigued in learning a bit more about significant severe weather days in the Northeast. From 2010 - 2022, the Northeast has seen 18 severe days that have featured at least an EF-2 rated tornado or higher (i.e., a strong tornado that often produces considerable damage with wind speeds of 111 - 135 mph), and 31 total days that have seen at least a report of 2" diameter hail or larger (i.e., hen egg sized hail that can result in property damage and injury or death to persons / animals). Lastly, 18 total severe days since 2010 have seen widespread wind damage with 75 or more damaging wind reports. As this shows, destructive hail and violent tornadoes can occur, even if they less numerous.
We hope these stats give you a better idea of the when and where behind the occurrence of Northeast severe weather events. Also, you may be able to better assess your risks to these severe weather hazards, and thereby be more prepared before the next severe weather event strikes!


