
Many times, meteorologists use technical terminology during weather discussions. Some of the acronyms used can understandably come off as a form of "alphabet soup". Perhaps one of the most widely used terms in the industry is “El Niño” or its counterpart “La Niña.” While you may have heard of these, what do they actually mean and how can they impact weather patterns in your neck of the woods? Let's investigate...
El Niño and La Niña are both prominent phases of the larger pattern known as the El Niño Southern Oscillation (ENSO). Additionally, the phase of ENSO (an ocean oscillation) is strongly tied to a specific atmospheric pattern known as the Walker Circulation. Normally, trade winds across the tropics blow in a counterclockwise pattern and results in easterly winds across equatorial regions. This circulation has two main impacts: The first is to transport warmer, tropical waters across the central and western Pacific Ocean. The second increases upwelling of cooler water off the South American Coast and Eastern Pacific Ocean. This results in a circulation pattern that promotes increased ocean temperatures, cloud cover and precipitation across the Western Pacific Ocean and most of Indonesia. Conversely, cooler ocean temperatures, associated with high pressure and drier weather, are typically found across the Eastern Pacific (see the top part of diagram below).
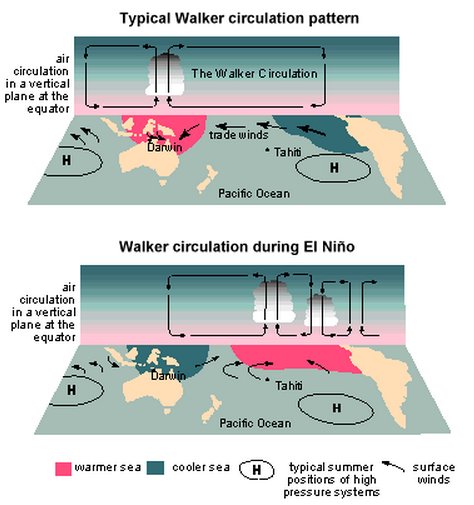
During La Niña, this pattern is enhanced…resulting in stronger easterly trade winds, more upwelling (of cool water) off the coast of South America and a pronounced increase in sea surface temperatures across the Western Pacific Ocean. During El Niño, the opposite occurs, and the trade wind pattern either weakens considerably or is even reversed. As a result, warmer than average water temperatures are usually found off the South American Coast and across the Eastern Pacific in general. Similarly, warmer water is transported away from the West Pacific, which results in cooler ocean temperatures across Indonesia (see bottom part of previous diagram).
Strength of El Niño/La Niña Matters!
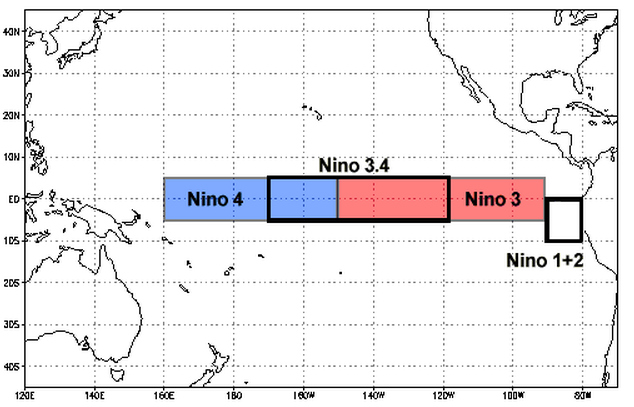
Because ocean temperature departures are the main impact of this circulation, the strength of ENSO depends upon the sea surface temperature anomalies (departures from average) for various regions across the Pacific Ocean. The attached diagram below shows the four main regions for which temperature anomalies are calculated. Although all of these regions are important to some degree, years of research has shown that departures across region 3.4 (outlined in the black box) are most important when calculating the phase and strength of ENSO. Generally speaking, La Niña conditions correspond to at least five consecutive months averaging temperatures less than -0.5°C. Conversely, El Niño conditions correspond to readings averaging at or greater than +0.5° over the same time period. Note that the further removed the sea surface temperature is from its average position will result in an increasingly strong El Niño or La Niña. For instance, a departure of just +0.6° would indicate a weak El Niño, whereas a departure of +1.8° would correspond to a strong El Niño. Similarly, a departure of -0.6° would be indicate of a weak La Niña, whereas an anomaly of -1.8° would correspond to a strong La Niña.
So why is the strength of an El Niño so important? The reason is (with all other things being equal) a strong El Niño will promote a different weather pattern than a weaker event. Overall, El Niños (regardless of strength) are often marked by an enhance split flow pattern and a stronger than average southern jet stream. This will favor wetter and cooler conditions across a good portion of the Southern US. Conversely, the Pacific Northwest will generally experience milder than normal temperatures during an El Niño.

Ideal weather pattern and associated temperature departures during a Strong El Niño
The images above and below portray the idealized pattern and associated temperatures anomalies for a strong and weak El Niño respectively. While the strong split flow is present in both of them, there are important differences in the orientation of the polar jet stream. A weaker El Niño (below) will favor a ridge of high pressure across the western North America and a trough of low pressure over the eastern part of the continent. As a result, the Midwest, Ohio River Valley and East Coast generally see colder than normal temperatures. In contrast, the polar jet stream is displaced further north into Canada during strong events (above). This promotes above average temperatures anomalies across our region, as milder air is able to spill across the whole northern tier of the country. This was the dominate pattern during the winters of 1982-83 and 1997-98, the two strongest events on record.

While winters in the Midwest usually end up milder and drier than usual, it is important note that the correlation between strong El Niño becomes weaker as you move into the Northeast and Mid-Atlantic. While snowfall totals average out below normal overall during strong El Niños, they have been quite variable from event to event. Also we stress that there are other factors to consider when preparing a seasonal forecast, such as the sea surface temperatures across the Gulf of Alaska. In addition, teleconnections such as the Arctic Oscillation have a profound impact on how much snow we get in the Eastern US.


